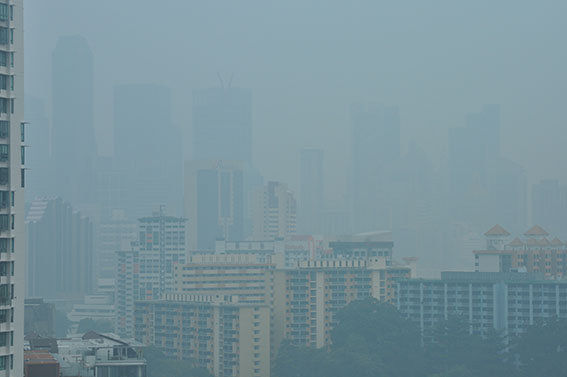
Living with the haze in Singapore.
Thunder, lightning and rain were a blessing through the night. Listening to the gentle tapping of rain drops on the window confirmed I’d been right switching off the airconditioning and air filter last thing. Rain always brings an interlude of clearer atmosphere. This was no exception with the PSI dropping to 87 and the PM2.5 to 95 from peaks of 224 and 274 in the previous 24 hours.

Sitting here in Singapore over the past two weeks I’ve watched as levels of air pollution have risen. In this connected island nation with it’s ultra fast Internet gathering information about the problem is easy. The Haze Information Portal is my first reliable source of data. When the levels of air pollution rise to unhealthy I wear a mask to help filter out the PM2.5 the particles in the air that are smaller than 2.5 microns, the ones that can travel deep into the lungs.
The Air Quality Index (AQI)
Anyone living in a city listed in the Air Quality Index website can check their city’s AQI by using this link I’ve set up for South, Singapore. Just click on this link and search for your own city.

The pollution indices and color codes available on this website follow the EPA graduation, as defined by AirNow and explained in wikipedia.
An experiment
As an experiment I just walked about 300 metres to the Zion Road Hawker Centre without wearing my mask. The entire journey was conducted with PM2.5 at 167, in the red band. I wore a mask on the return journey. Now my nose is itchy, I’m sneezing, I can feel a burning sensation deep inside my nose and the back of my throat. My voice is slightly hoarse. I’m actually in an at risk group and I’m by no means alone.
This is the last time I’ll attempt the experiment.
Source of the haze
After a few days living with the haze, particularly if PM2.5 reaches Hazardous, which it has done, reflecting on the cause of the problem is inevitable. In our case the problem is Indonesia, Sumatra to be precise, although it’s not alone, Kalimantan also has huge problems. Of course none of this is new, it’s been going on for a while. A friend who lived in Singapore back in 1993-94 reports encountering the haze.
This season in 2013 was also bad for haze but arguably the worst to date was the period 1997-98. At that time major forest and peatland fires broke out in South East Asia. Some of the areas plagued by fire were already very familiar to me, notably the Kutai region of eastern Kalimantan. An El Nino induced drought brought the critical conditions necessary for fire to break out in areas that had already been partly cleared of forest cover and contained huge fuel loads. A total of 10 million ha of forest was burnt during that time, primarily in Indonesia, but also in Malaysia, Brunei and Thailand. The fires burned or damaged over 1.45 million ha of peatlands, about 4% of the total peatland areas in the region. One million hectare of peat swamp forest in Indonesia was damaged in this period (BAPPENAS, 1999). Fires in the area of peat soils were identified as the major contributors (about 60% of particulates) to the smoke and haze which enveloped a major part of the region and contributed to an estimated economic loss of US$9 billion. [1]
Indonesian environments and palm oil plantations
Most people probably think of Indonesia as a land of rice fields and rainforests, and it is, but it’s also a land of monsoon forests, mangroves, nipa palm swamps and swamp forests. It’s in these swamp forests that the source of the problem lies dormant. If they are left undeveloped or developed in sustainable ways the problem usually doesn’t arise, but unfortunately they are falling victim to the rapidly expanding oil palm industry. Indonesia is the world’s largest Crude Palm Oil producer with about 10 million hectares of Palm Oil Plantation, more than 600 Palm Oil Mills, about 120 refineries, and some palm kernel oil mills, oleo chemical companies and biodiesel factories.
Palm oil is the world’s most widely consumed vegetable oil representing 34% of all vegetable oils consumed with soybean oil in second place at 27% of vegetable oils consumed. As the world’s largest palm oil producer, Indonesia is responsible for 52% of the world output. Production grew 11% per year between 1993 and 2013. Malaysia produces 34% of the global output. Combined Indonesian and Malaysian palm oil production in 2012 was valued at about $40 billion.
Well established palm oil plantations
Around 70% of Indonesia’s palm oil plantations are in Sumatra and the remaining 30% in Kalimantan. These islands also contain stands of tropical rainforests. Early palm oil plantations were often established in areas where rainforests had been logged for their valuable timber. One notable area was the coastal fringe to the north-east of 3°N 99°E in North Sumatra province then extending south-east into the inland areas of Riau and Jambi provinces.
Mapping the Sumatran palm oil industry
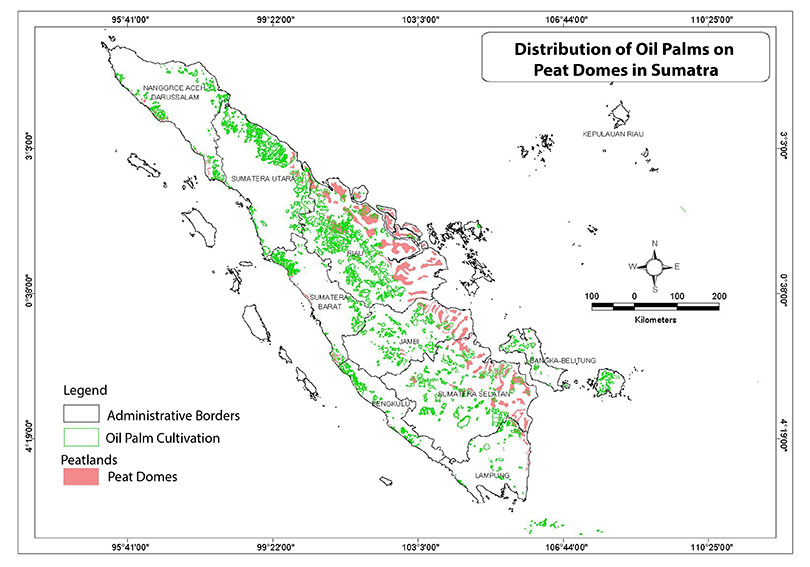
- Coastal areas of Sumatra support extensive swamp forests
- Acknowledgement: B. Barus, Diar Shiddiq, L.S. Iman , B. H. Trisasongko, Komarsa, G, dan R. Kusumo) Staf Bagian Inderaja dan Informasi Spasial, Departemen Ilmu Tanah dan Sumberdaya Lahan, IPB; Peneliti Pusat Pengkajian Perencanaan dan Pengembangan Wilayah, LPPM, IPB; Presented in National Seminar Sustainable Peat Land Management in the Agricultural Land Resources Agency (ALRA), Bogor, May 4, 2012

Early oil palm plantation development tended to be mostly in well-drained areas with undulating to hilly landforms.

- Sumatra Topography. (CCL. Author Sadalmelik)

Recent oil palm plantation development is being undertaken in the swamp forests and associated peatlands within the north-eastern coastal areas of Sumatra.
Tropical swamp forests and peatlands in Indonesia
Peatlands cover at least 9% of the Indonesian land surface, the exact area is somewhere between 16.8 and 27.0 million ha. They form in swamp forests. The process of peat land formation is illustrated in the following diagrams.

Peat is dead organic matter accumulated in a wet oxygen depleted environment, it is about 90% water and 10% plant matter. Such a high water content creates what is called a perched water table in the peat dome. Water retained in a peat dome is higher than in surrounding areas.
Deposits can accumulate over 1000s of years and those in South East Asia have been forming since sea levels stabilised after the Pleistocene, at the beginning of the Holocene.
About 70% of tropical peatlands are found in South East Asia. Most occur in coastal or peri-coastal swamp forests or lowland river catchments in areas of Indonesia in Sumatra, Borneo (Kalimantan) and West Papua, Papua. They play an important role in flood mitigation during wet seasons and maintaining water supply during dry seasons.
Tropical peat domes can be up to 50 km wide occupying entire catchments between adjacent rivers.
Although peat swamp forests have many species of valuable dipterocarps limited access, and the preponderance of dipterocarps in the larger tropical forests within more well-drained areas, ensured that they were less disturbed until recently. Consequently they have remained an important habitat for animals. In Sumatra peat swamp forests are habitat for endangered species like Orang Utan, Sumatran Tigers and Rhinocerous.
A store of carbon
Peat deposits are a large and highly concentrated carbon store. Peatlands and organic soils contain 30 percent of the world’s soil carbon but only cover 3 percent of the Earth’s land area. [3] It is estimated that carbon storage in peatlands is up to 58 kg per cubic metre. Their capacity for carbon sequestration alone makes them a valuable global asset.
Exploiting Sumatra’s peat lands
Given the huge income earning potential of the palm oil industry the clearing of swamp forests is increasing. In Indonesia cleared peatlands under oil palm cultivation are expected to increase to between 6 and 9 million ha by 2020, amounting to about one-third of total peatlands. Such a large intervention will have major environmental consequences.
Methods of clearing
Clearing swamp forests and associated peatlands is a two stage process:
- canals are dug through peat domes so that water drains away. This causes the peat dome to subside.
- remaining forest cover is slashed and burned.
The process is well documented in Singapore’s Straits Times newspaper of October 1, 2015. There are some brilliant graphics.
The CO2 problem
Once peatlands are drained they begin to release CO2. Once they are burnt the release of CO2 increases dramatically.
Subsidence in the coastal and peri-coastal areas where peatlands are drained and burned presents additional problems going into the future. More severe flooding exacerbated by sea level rise could render significant cleared tracts of land peatland unusable.
Summarising the impacts
Solutions
- The Food and Agriculture Organisation of the United Nations offers this paper to the discussion on strategies for approaching the problem, Towards climate-responsible peatlands management.
- Wetlands International also offers solutions in this document, Tropical peatlands, current issues and possible solutions, that can be readily adapted into a PowerPoint or Keynote presentation
- Mitigation of Climate Change in Agriculture (MICCA) Programme outlined in Peatlands – guidance for climate change mitigation through conservation, rehabilitation and sustainable use is also a useful resource on ideas for migigating the effects of peatland and wetland destruction which takes a more global approach.
- Tackle illegal intrusions into Peatland National Parks
- The World Resources Institute offers these stratregies in Preventing Forest Fires in Indonesia: Focus on Riau Province, Peatland, and Illegal Burning
- Using digital technology and satellites to help
- Finally the search facility in the Food and Agriculture Organisation website will turn up a rich stream of information on the problem and solutions
Why the air pollution and fires are such a problem at the moment
Apart from illegal and unregulated forest burning, three other geographic factors influence the problem, at any time. These factors are climatic and meteorological. Their interaction can intensify or modify the air pollution problem on a given day.
A primary driver is the monsoon
The southern monsoon brings south-west to south-easterly winds to Indonesia and mainland South east Asia


- Wind directions between Australia & S E Asia October 1, 2015.

The influence of the monsoon is easily shown in this wind direction chart for Thursday October 1, 2015.
While the Australian continent is still relatively cool, winds are spilling out of Australia as south easterlies. Moving off shore they become easterlies then as they pass over the Equator they are deflected becoming south easterlies as the pass over Sumatra. Now they begin to blow smoke over Sumatra, Singapore and Malaysia.
Variations in Weather
The wind direction on a given day will influence the intensity of the haze blowing over Singapore. This is determined by pressure cells.

- Synoptic chart of October 1, 2015

Variations in the isobars, particularly the wavy patterns along the Equator further influence local wind direction.
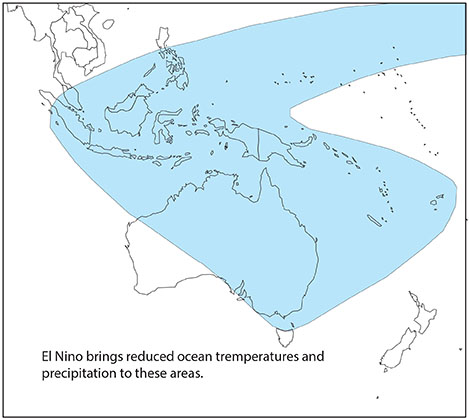
ENSO
The southern oscillation plays an important role, particularly when the Indonesian and Philippines archipelagos move into an El Nino. Aridity increases both intensifying and prolonging fire regimes.

-
Areas experience reduced ocean temperatures and evaporation during the El Nino phase.


Leave a comment