As one might expect, climate sceptics are having a sadly ignorant field day on the back of the present dump of snow in south-eastern Australia. Fortunately, most junior secondary school geography students could set them straight. In Australia students learn about the basic differences between climate and weather. Most understand that climate is not to be confused with weather. Unlike climate, weather is the state of the atmosphere at a particular place and time in respect to temperature, cloud cover, humidity, sunshine and wind.
Yesterday, Saturday 10 July, 2015, I made a quick review of the mean sea level pressure charts for South Eastern Australia and the Southern Ocean, mainly out of a desire to watch the origins of the cold snap we knew was developing.
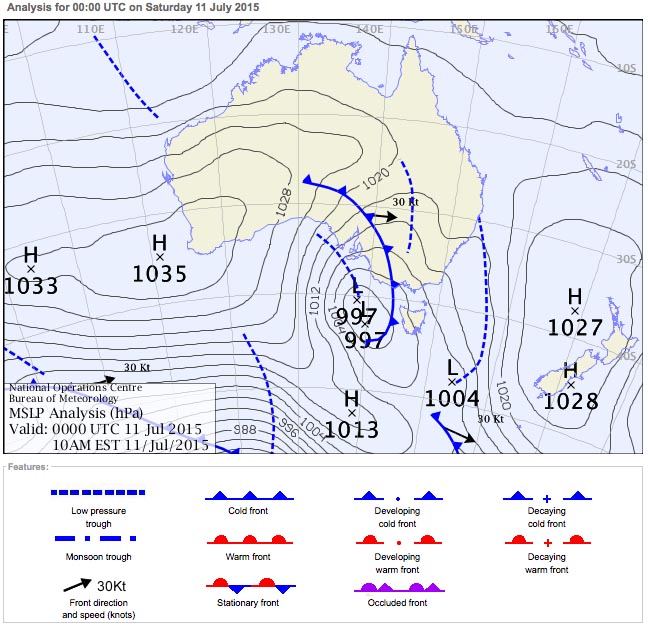
The cold front shown in the synoptic chart is driven by an inwardly spiraling cut-off low pressure system drawing on a higher pressure southerly air mass. Enhanced precipitation over southern Australia is the result.
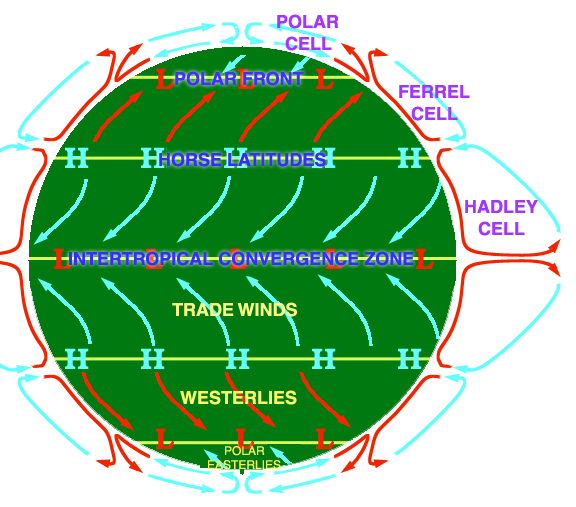
Australia’s weather and climate are influenced by seasonal variations in various air masses. The Australian Bureau of Meteorology notes that these Australian Climate Influences can vary greatly from one year to the next. The schematic below, and links on the right, present the main – but not all – influences upon the Australian climate. Influences will have varying levels of impact in different regions at different times of year.
An examination of the mean sea level pressure chart of the Southern Ocean provides a more comprehensive view of the air masses involved.
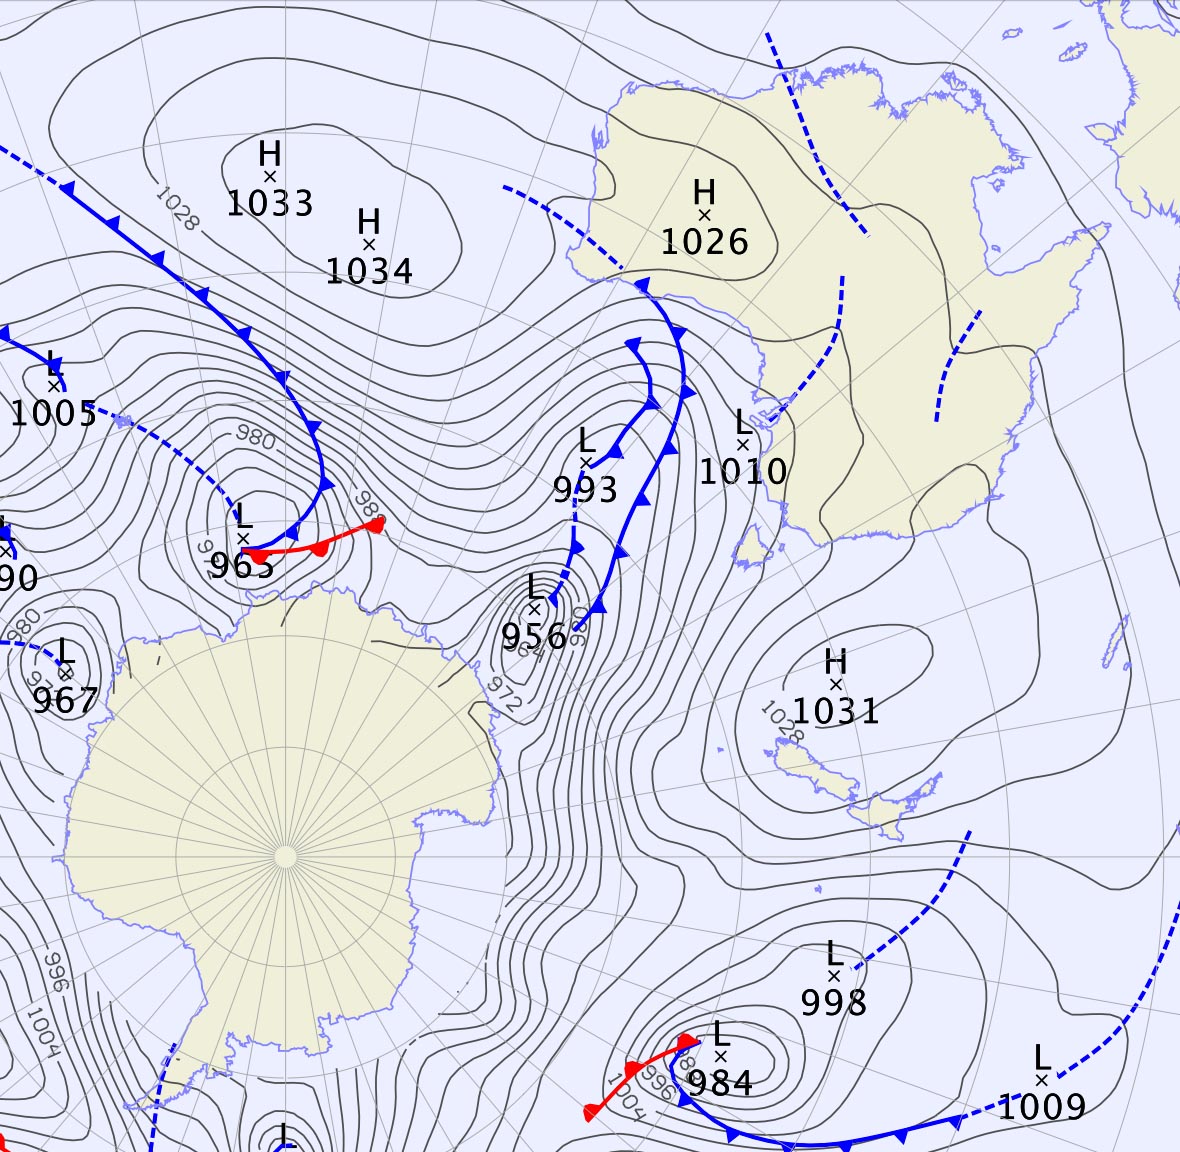
The polar low pressure systems are easy to spot in this chart. They are the product of uplift caused by the convergence of the Ferrel and Polar air masses, as shown in the following diagram of global circulation.
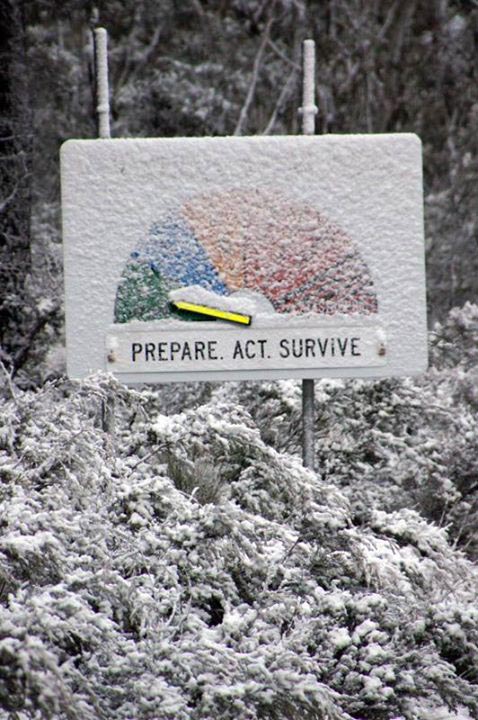
The making of a snowfall
The first good dump of snow in Australia’s winter season is always a time of both excitement and concern. Excitement at the prospect of the beautiful transformation about to occur along the eastern ranges and concern with the disruptions that inevitably follow.
I thought the best way to gather a sense of just how widespread this weather event has been was to harvest tweets from south-eastern Australia. Here is the Storify coverage of the event as told on Twitter.


Leave a comment